
One live view of every venue, scored every day.
See what is done, what is missed and exactly which sites need you today. Hopsy manages by exception, so instead of hunting for problems, you are pointed straight at them.
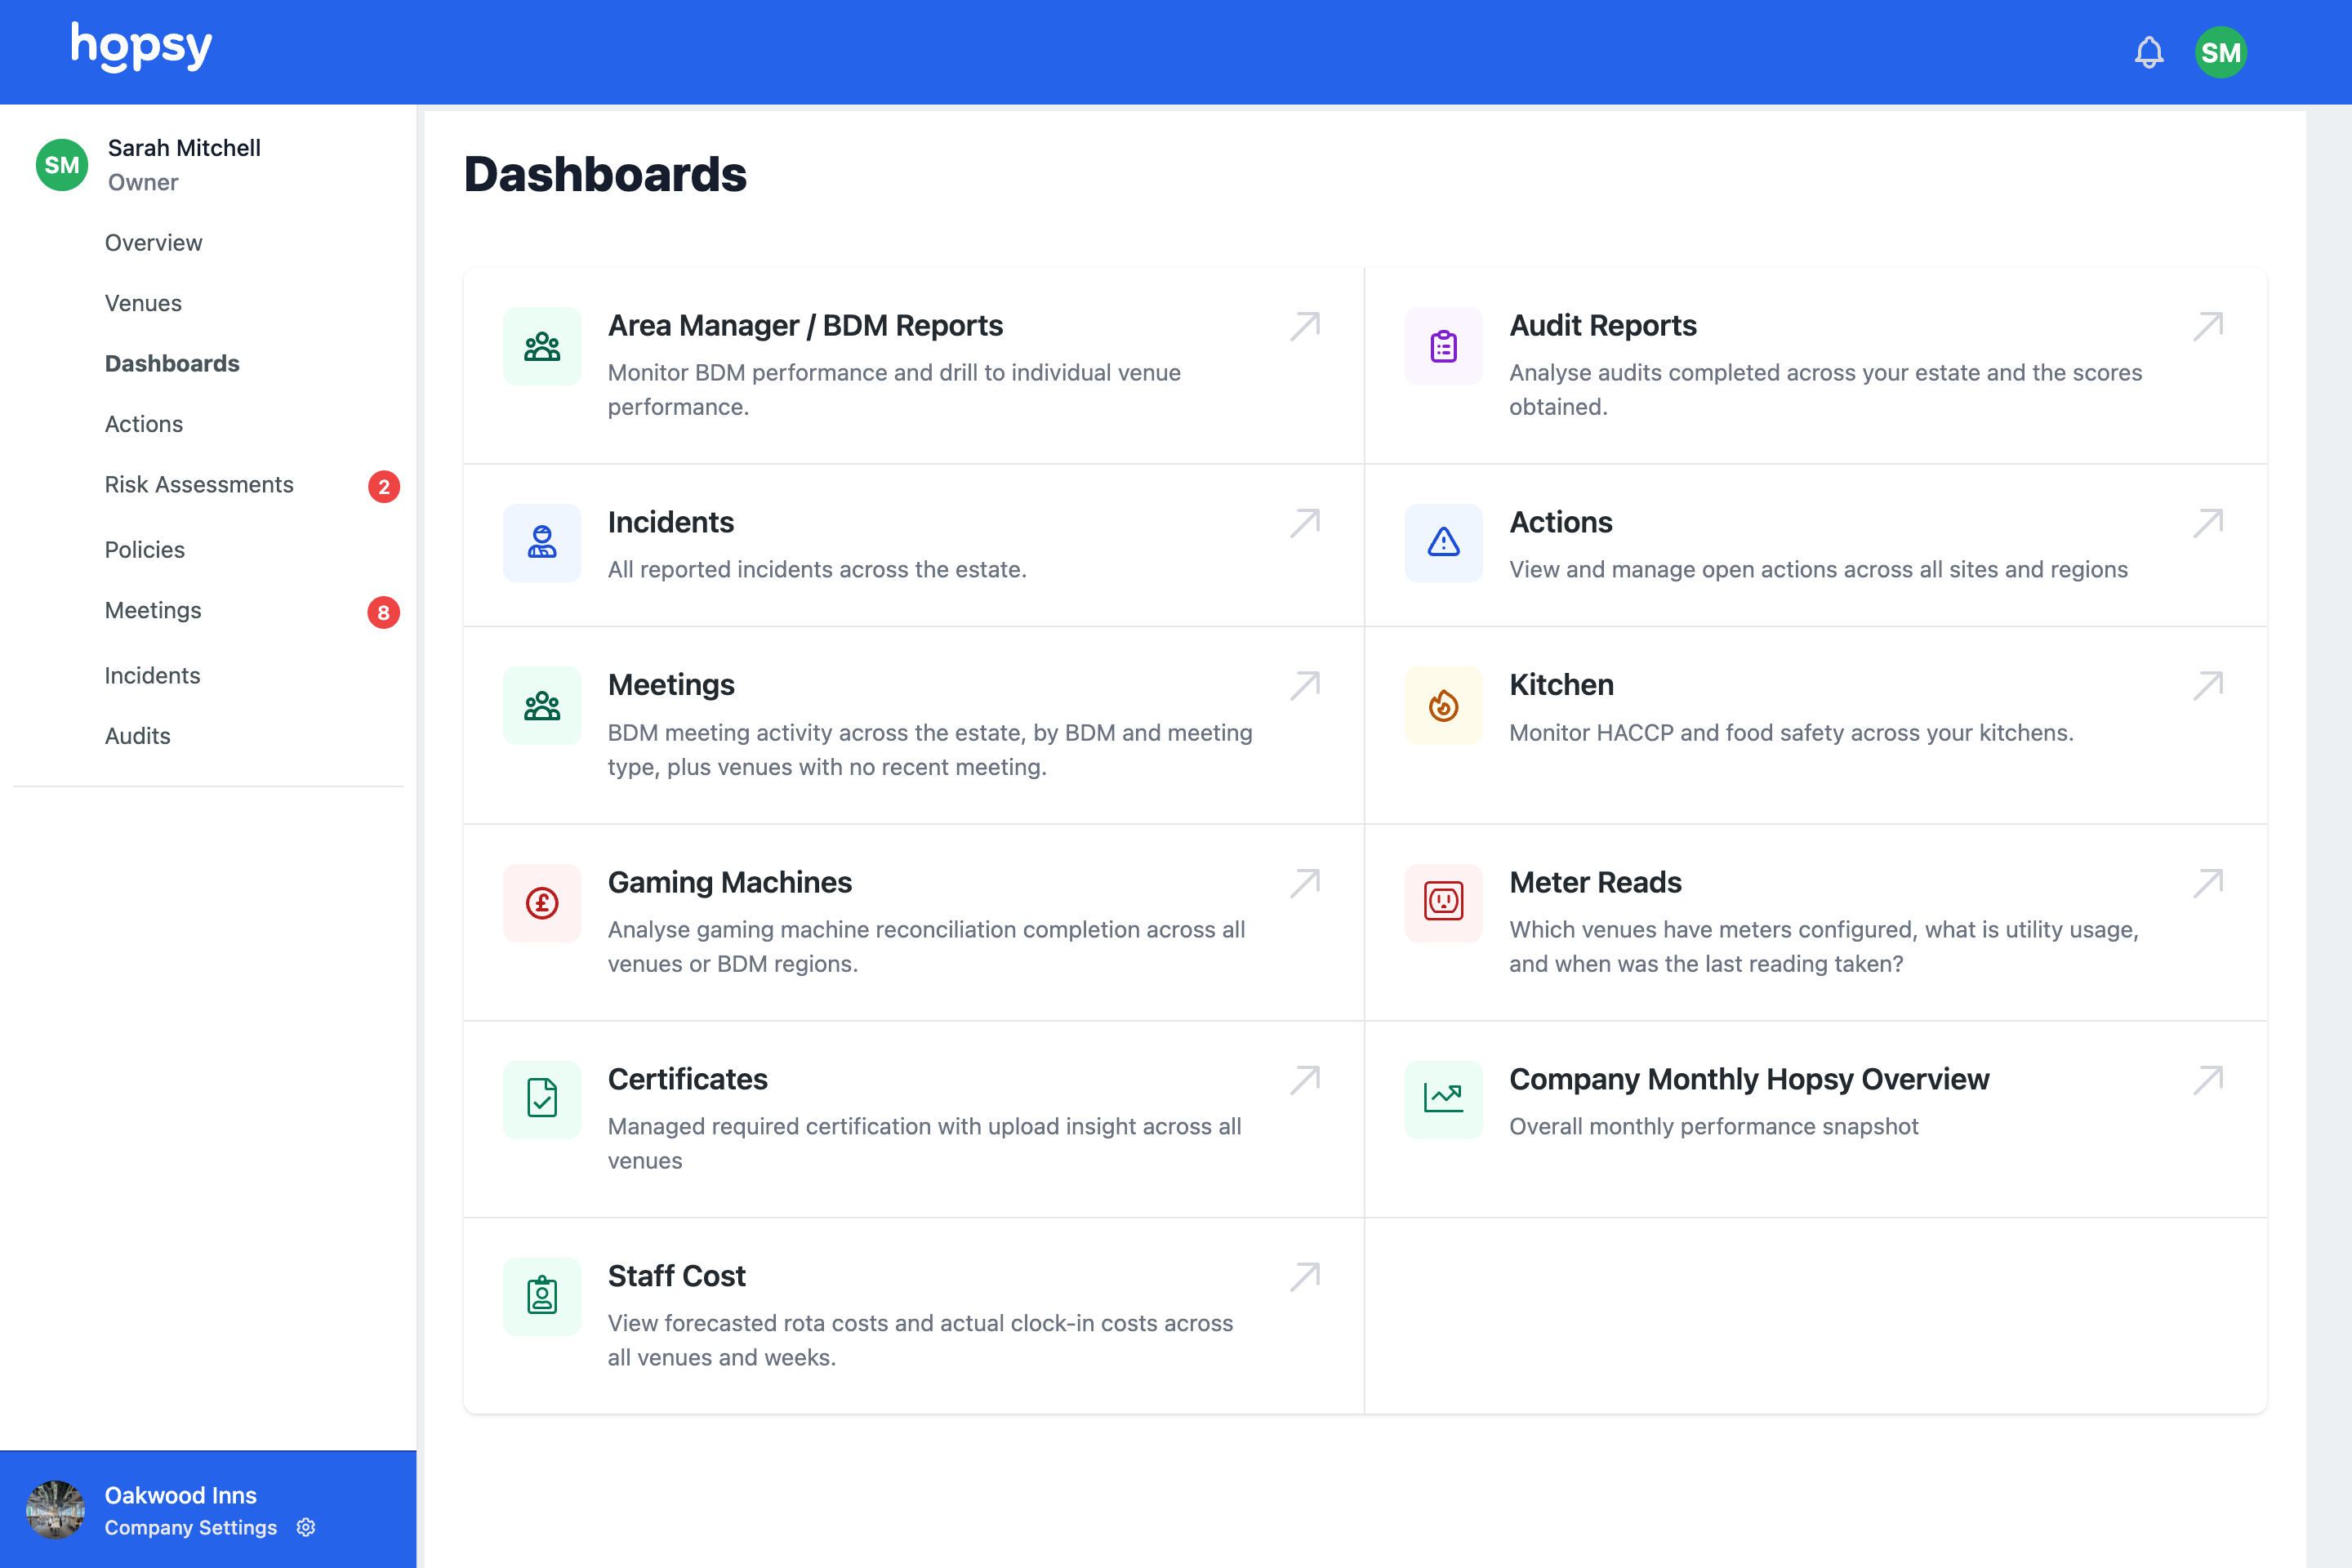
What is Hopsy's operations dashboard?
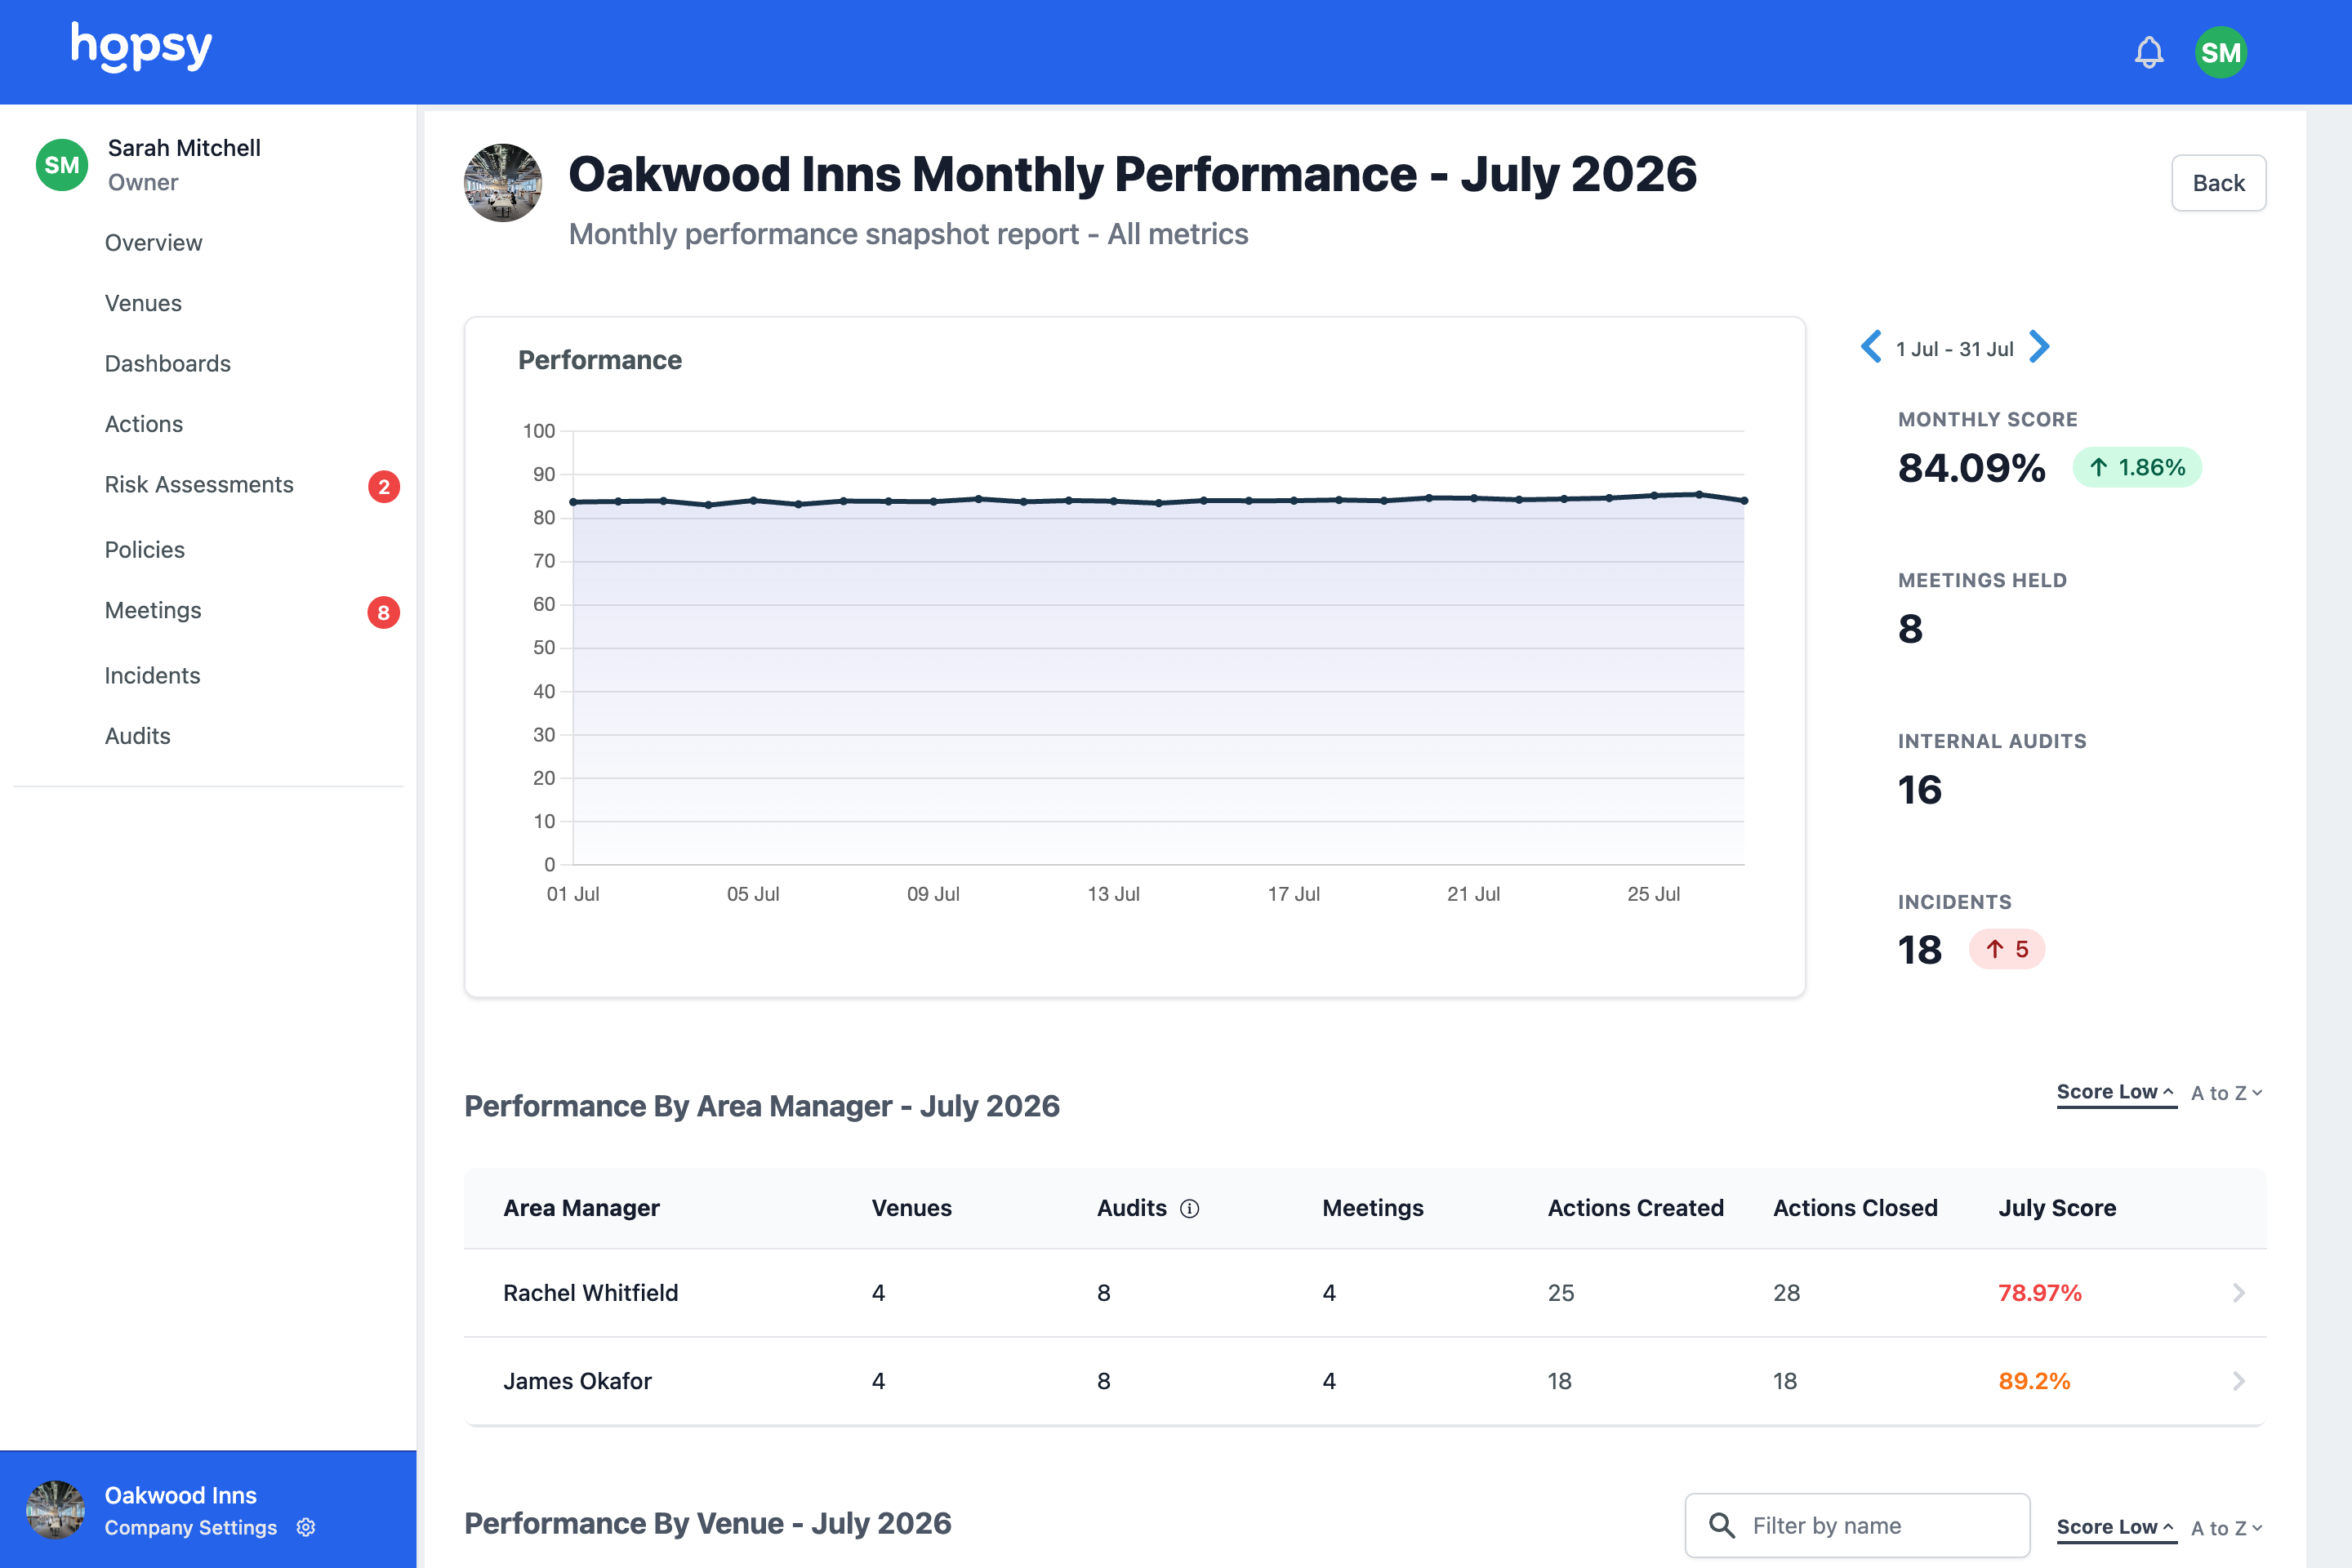
Hopsy's operations dashboard is one live view of every venue, scored every day on the checks and standards each site was set, with the sites that need you rising to the top. You can drill from the whole group, to an area, to a venue, down to the exact person or check behind a flag, and see meter reads, incidents, certificate expiry and cost in one place. It manages by exception, so instead of hunting for problems you are pointed straight at them, from any device.
The problem, if this sounds familiar
Running more than one venue means you cannot be everywhere. Without one view, it looks like this.
You run on trust and phone calls.
On your day away you are texting managers to find out whether things got done, and believing is not the same as knowing.
Problems reach you late.
By the time an issue at a quiet site gets to you, it has usually already cost you something.
You cannot compare sites.
With no single view, there is no fair way to see which venues are on top of things and which are slipping.
How the operations dashboard works
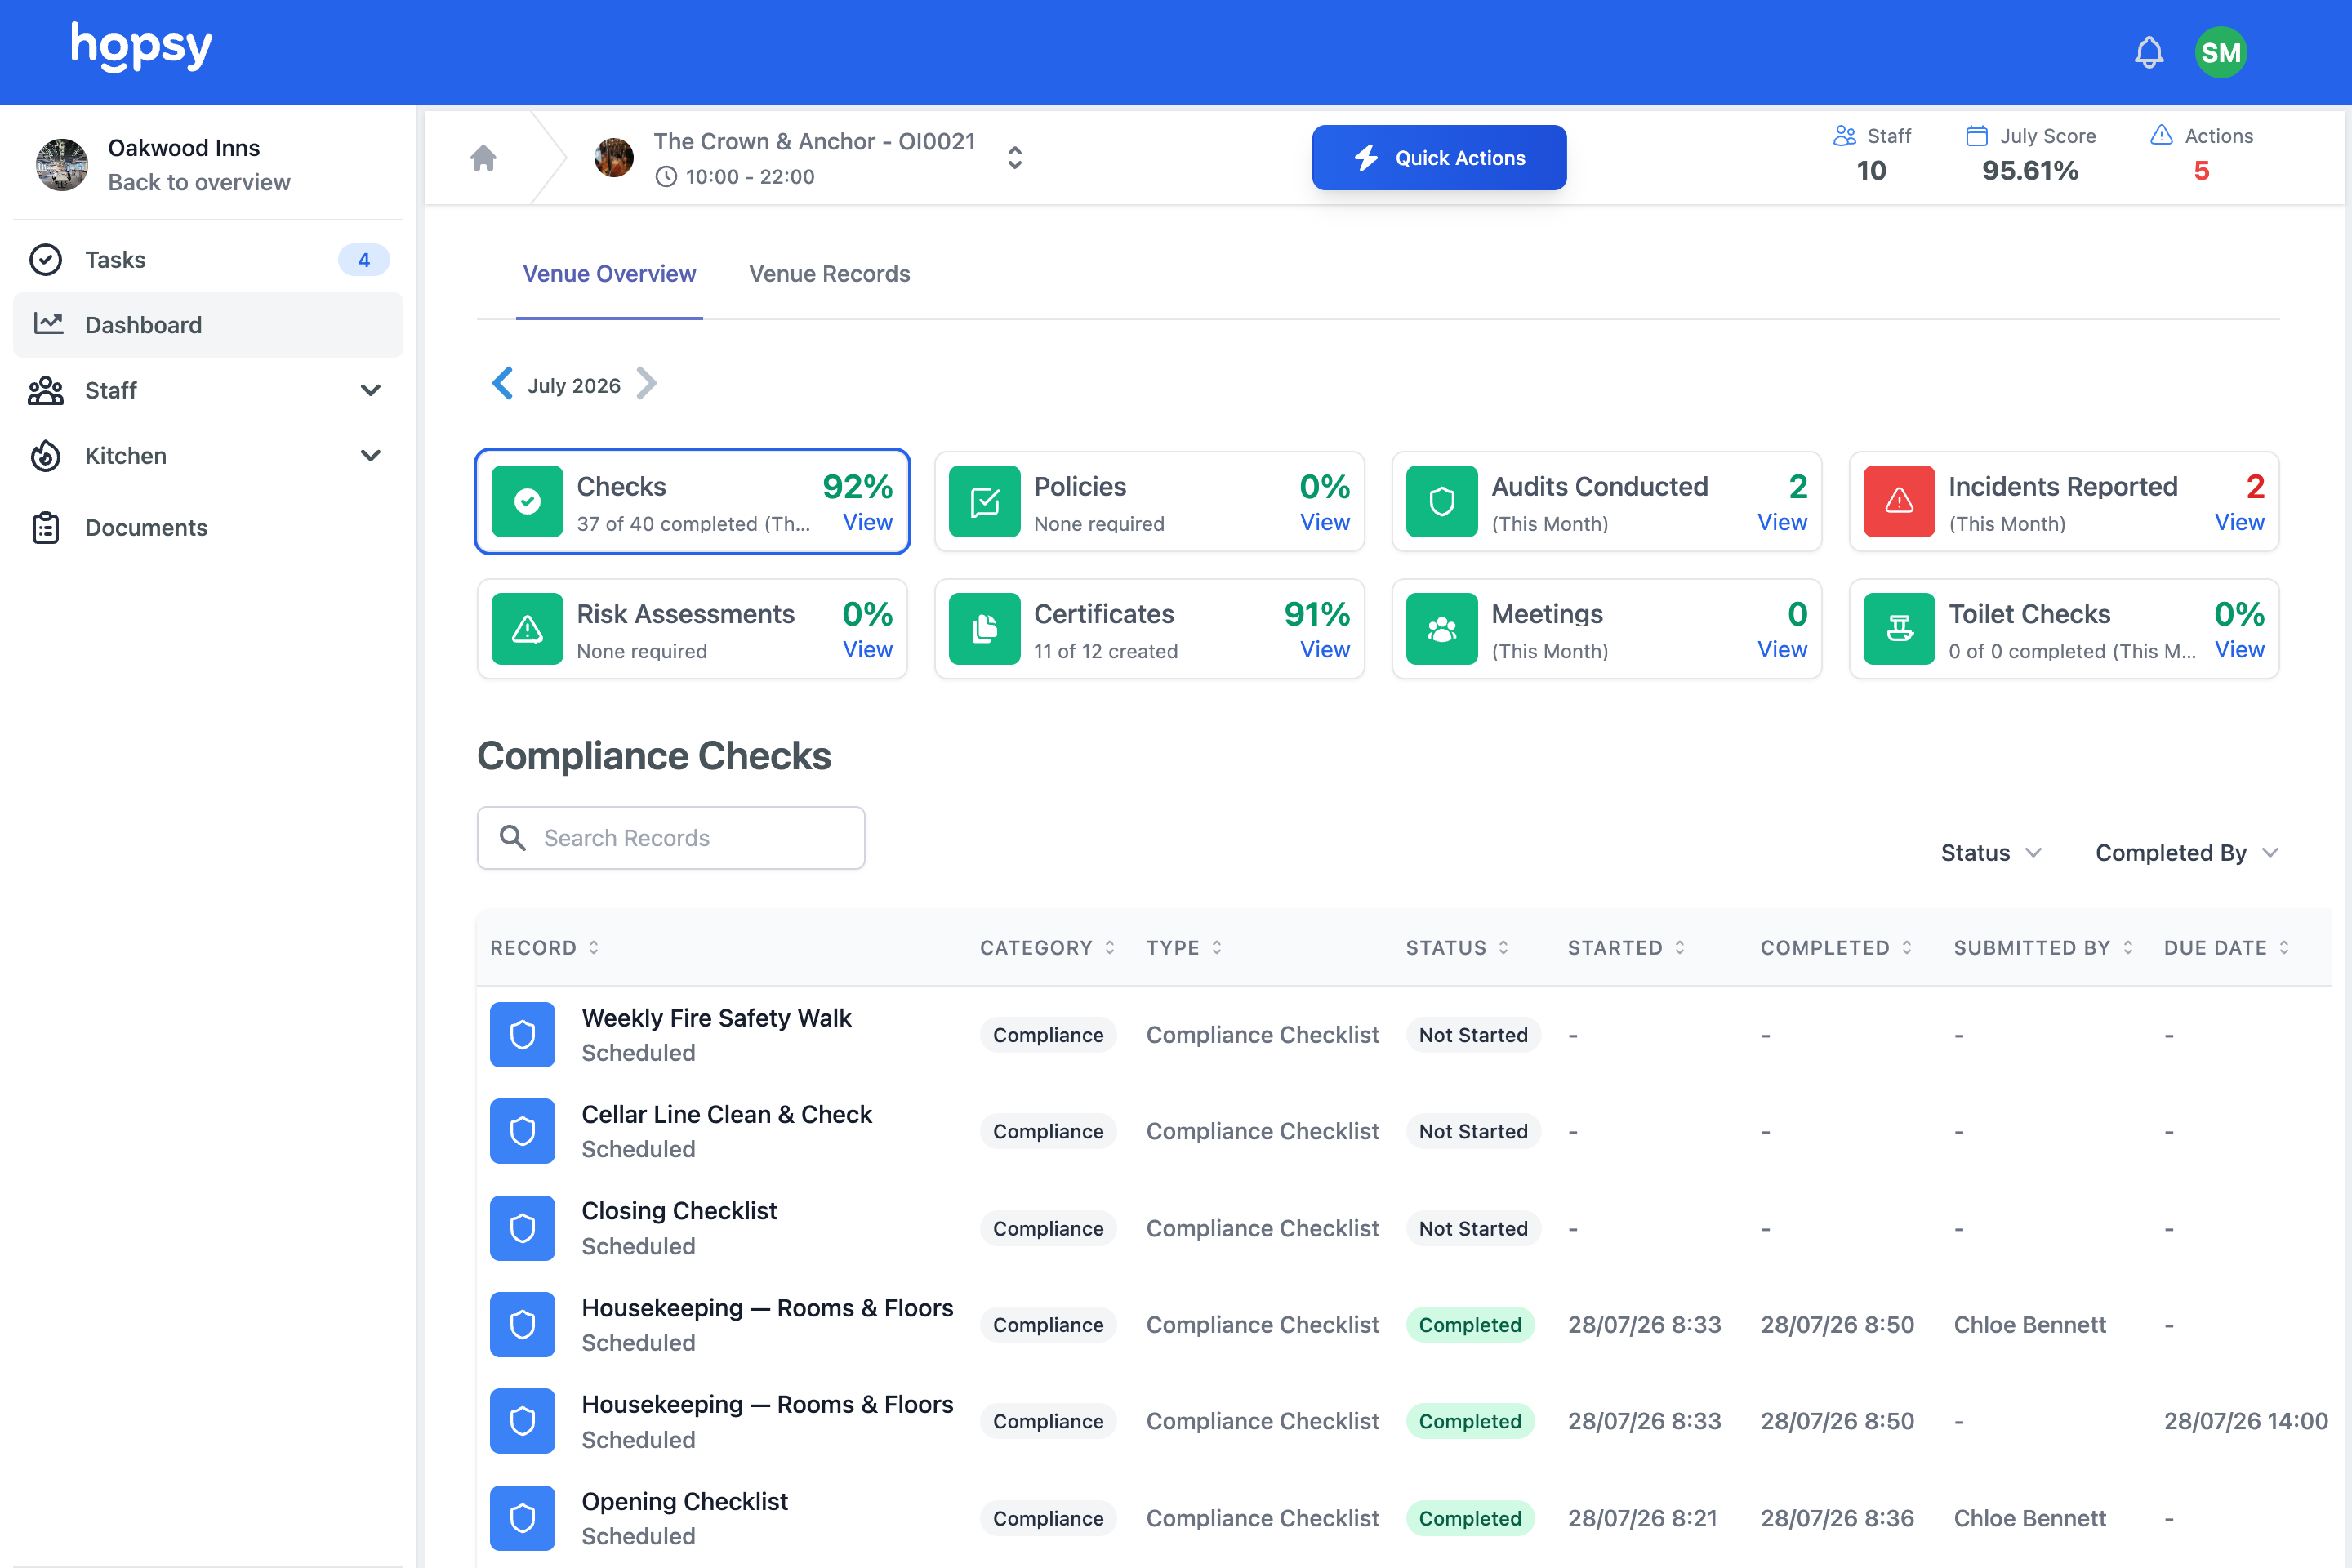
Every venue, scored daily
Each site is scored on the checks and standards it was set. Do them, and the score holds. Miss them, and it drops and stays down, so a low score points you straight at the site that needs you.
- A daily score for every venue
- Rolled up to area and company level
- The sites that need you rise to the top
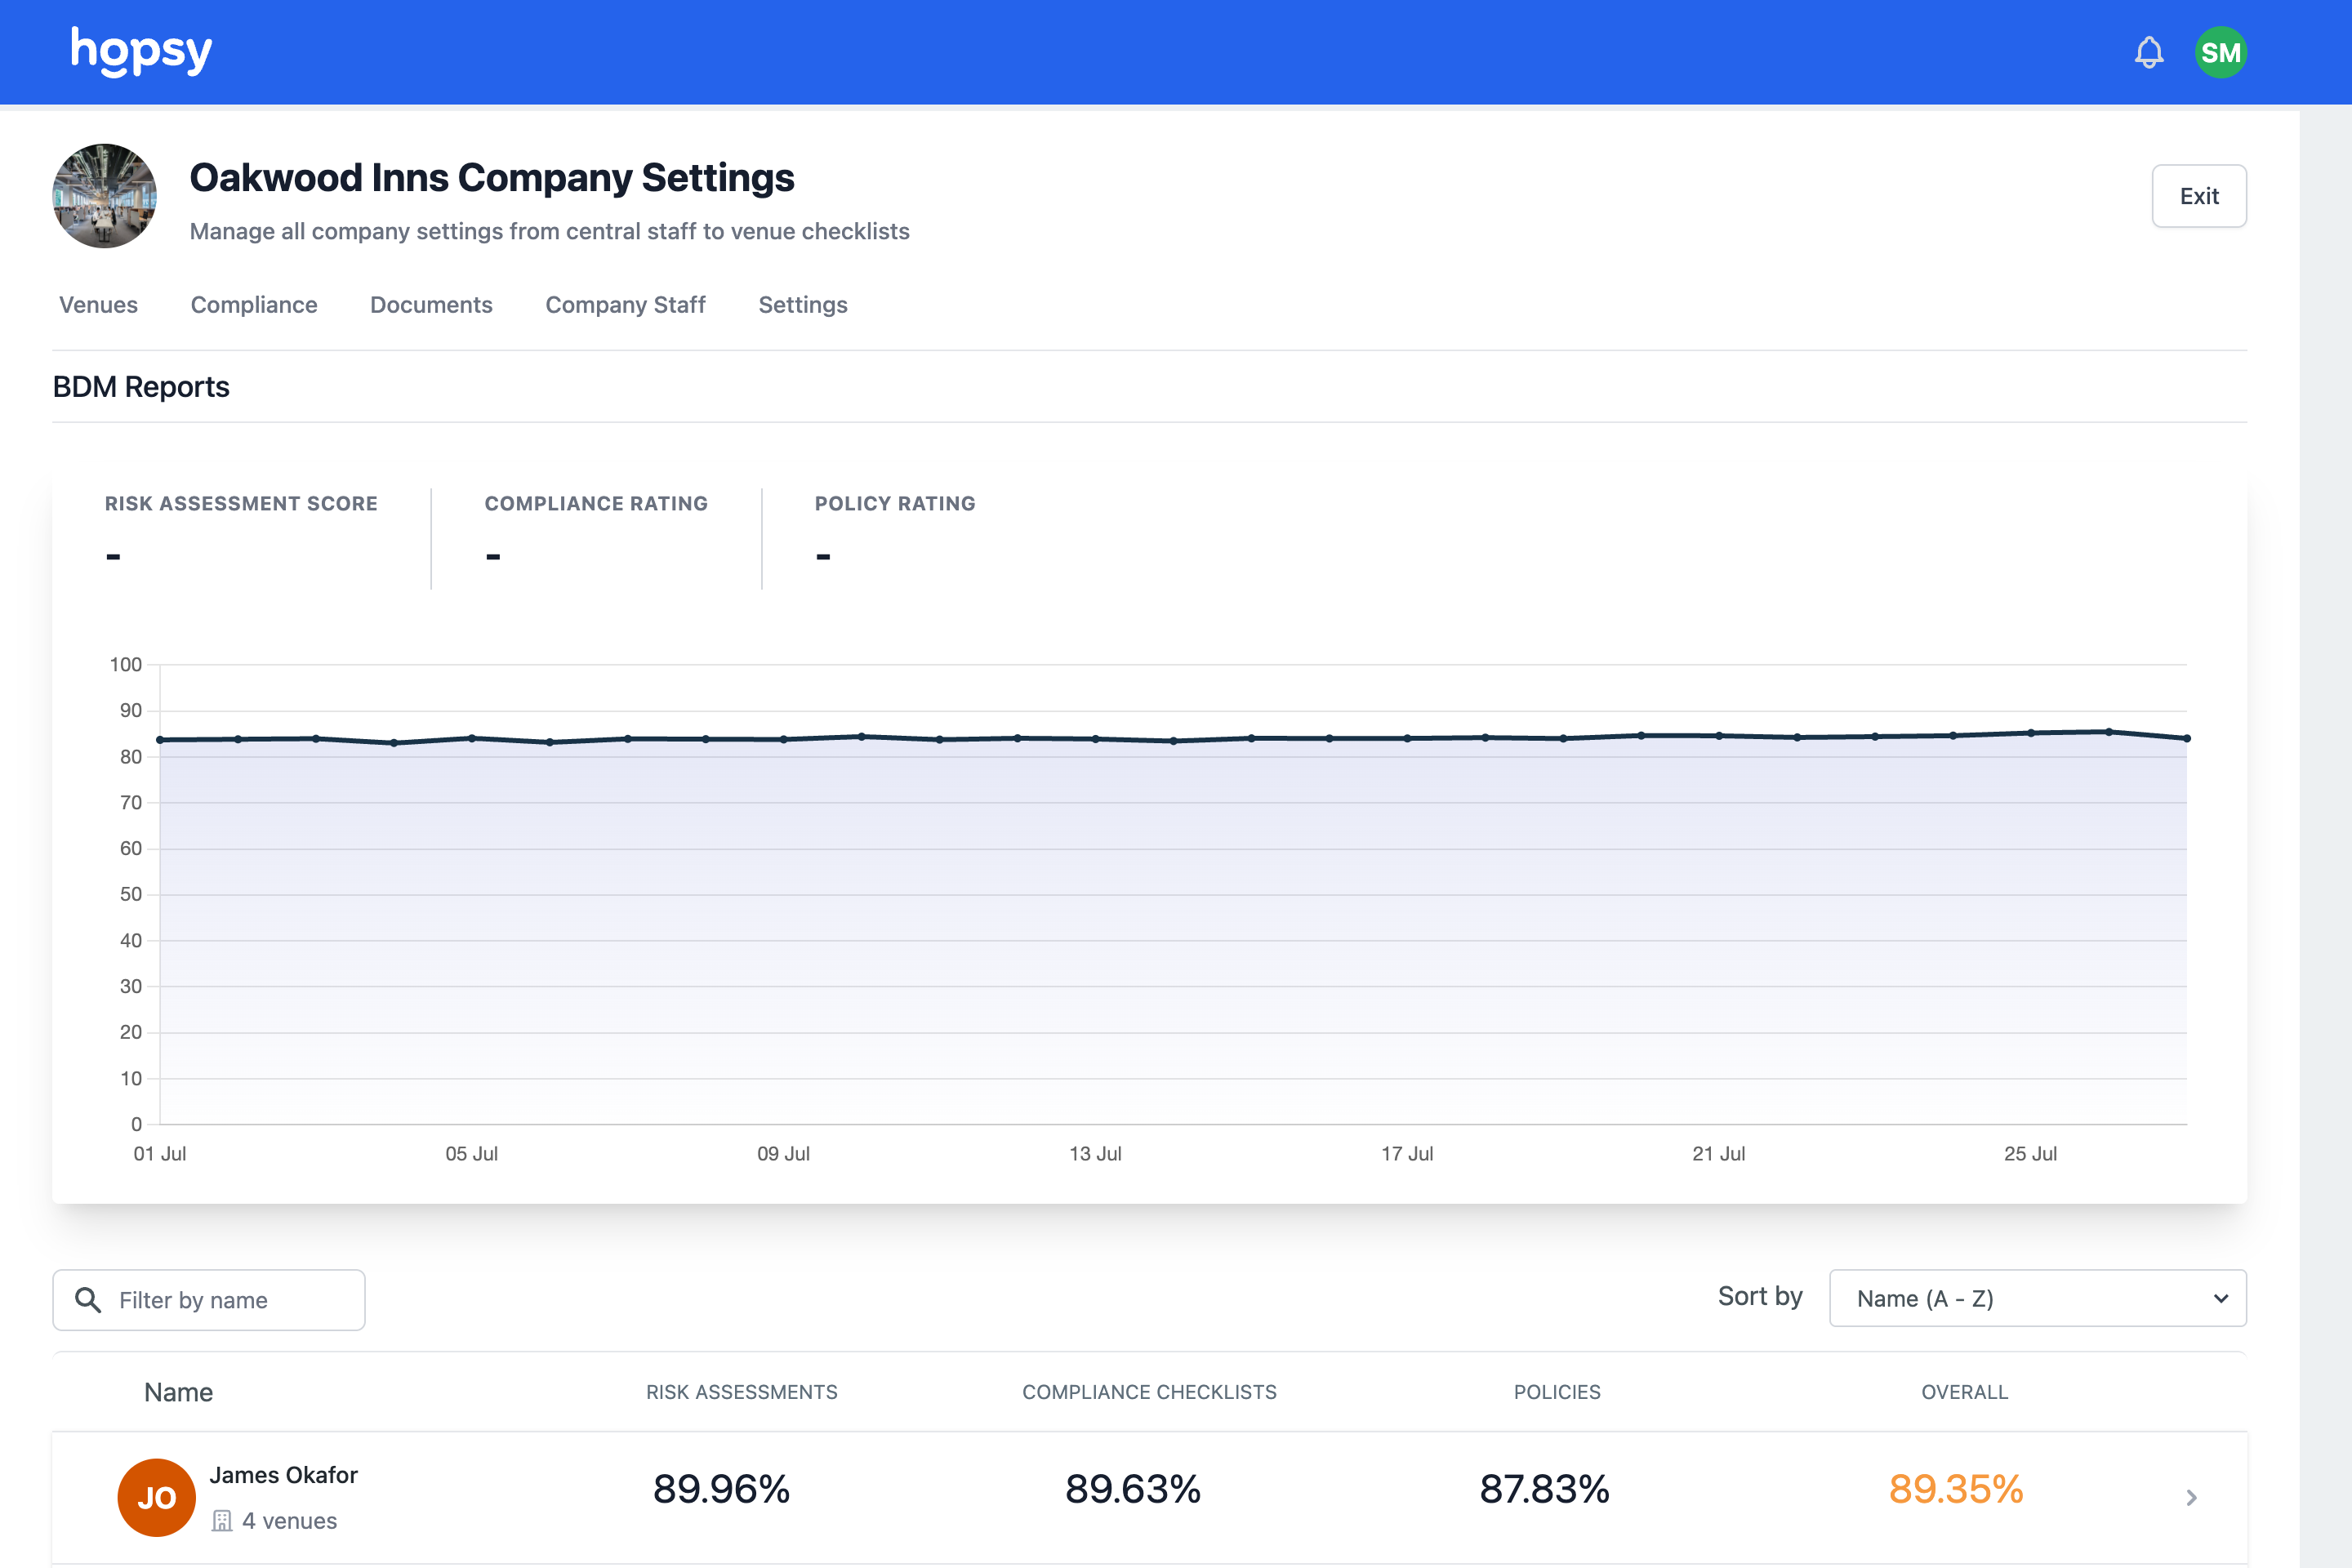
Drill from group to person
Start at the whole group, move to an area, down to a venue, and into the exact person or check behind a flag, so you always know precisely where the issue is.
- Group, area, venue and person views
- Red flags for missed checks and overdue actions
- The detail behind every flag, one click away
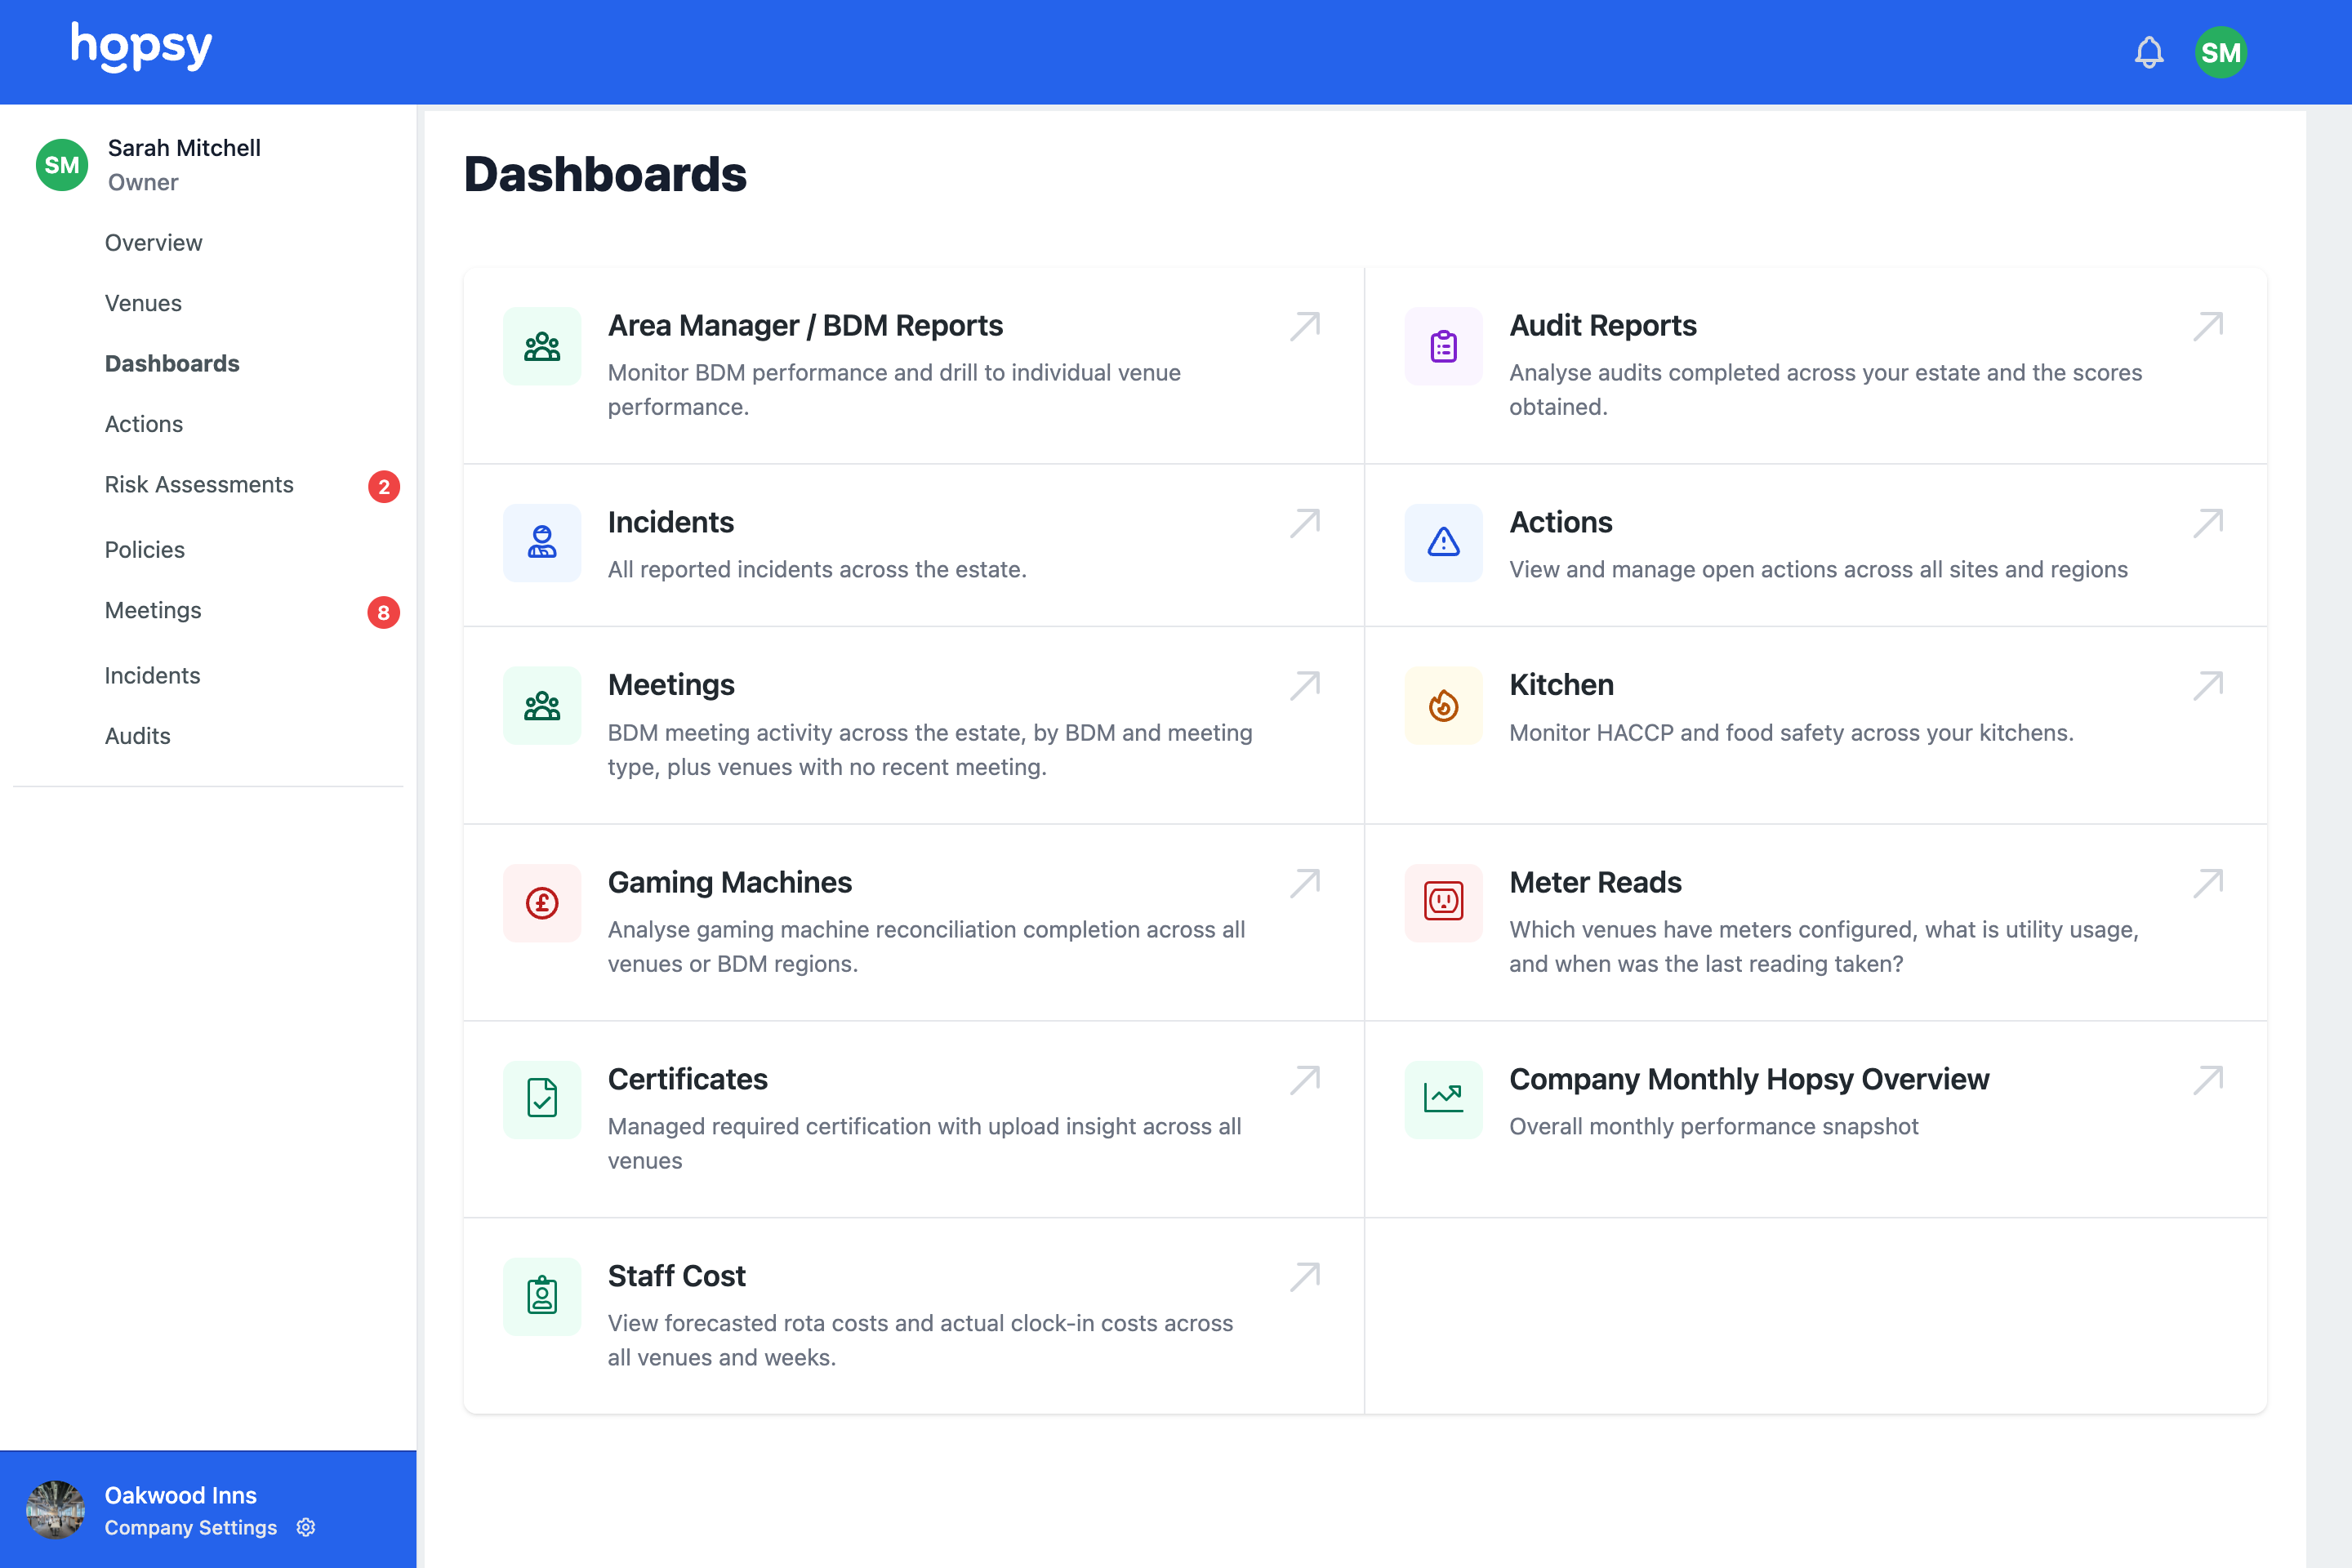
The things that only bite at scale
Energy meter reads, incidents, certificate expiry and cost all surface here, because across many sites these are the numbers that quietly add up.
- Meter reads, incidents and certificate expiry
- Cost and performance across the estate
- Real time insight without a reporting process
At a glance
- A daily score for every venue
- Rolled up from group to area to venue to person
- Red flags for missed checks and overdue actions
- Meter reads, incidents and certificate expiry in one place
- Real time insight across every site, from any device
See How Hopsy Can Help Your Business
From rota management to compliance and more. Hopsy is there to help you every step of the way.
Each is a way into the same connected system. Start with the one that’s hurting most — every feature builds to one of the five outcomes.
Operations dashboard, frequently asked questions
How is the venue score calculated?
It reflects whether a venue completed the checks, compliance and standards it was set, on time. Missed or overdue items pull it down, so a low score directly signals where to focus.
Can I drill into a specific site?
Yes. You can move from the whole group, to an area, to a venue, and into the exact person or check behind any flag.
Do I need to be on site to use it?
No. The dashboard is live on any device, so you can see today's picture across every venue from wherever you are.
See every venue the way you have never been able to.
Book an operations review and we will show you your own sites in one live view, or start free with a single venue.